Project Performance Analytics: The KPIs and Metrics Every PM Must Track in 2026
Cut project chaos without adding more meetings. Discover how agencies can streamline workflows, improve collaboration, and boost productivity with smarter management
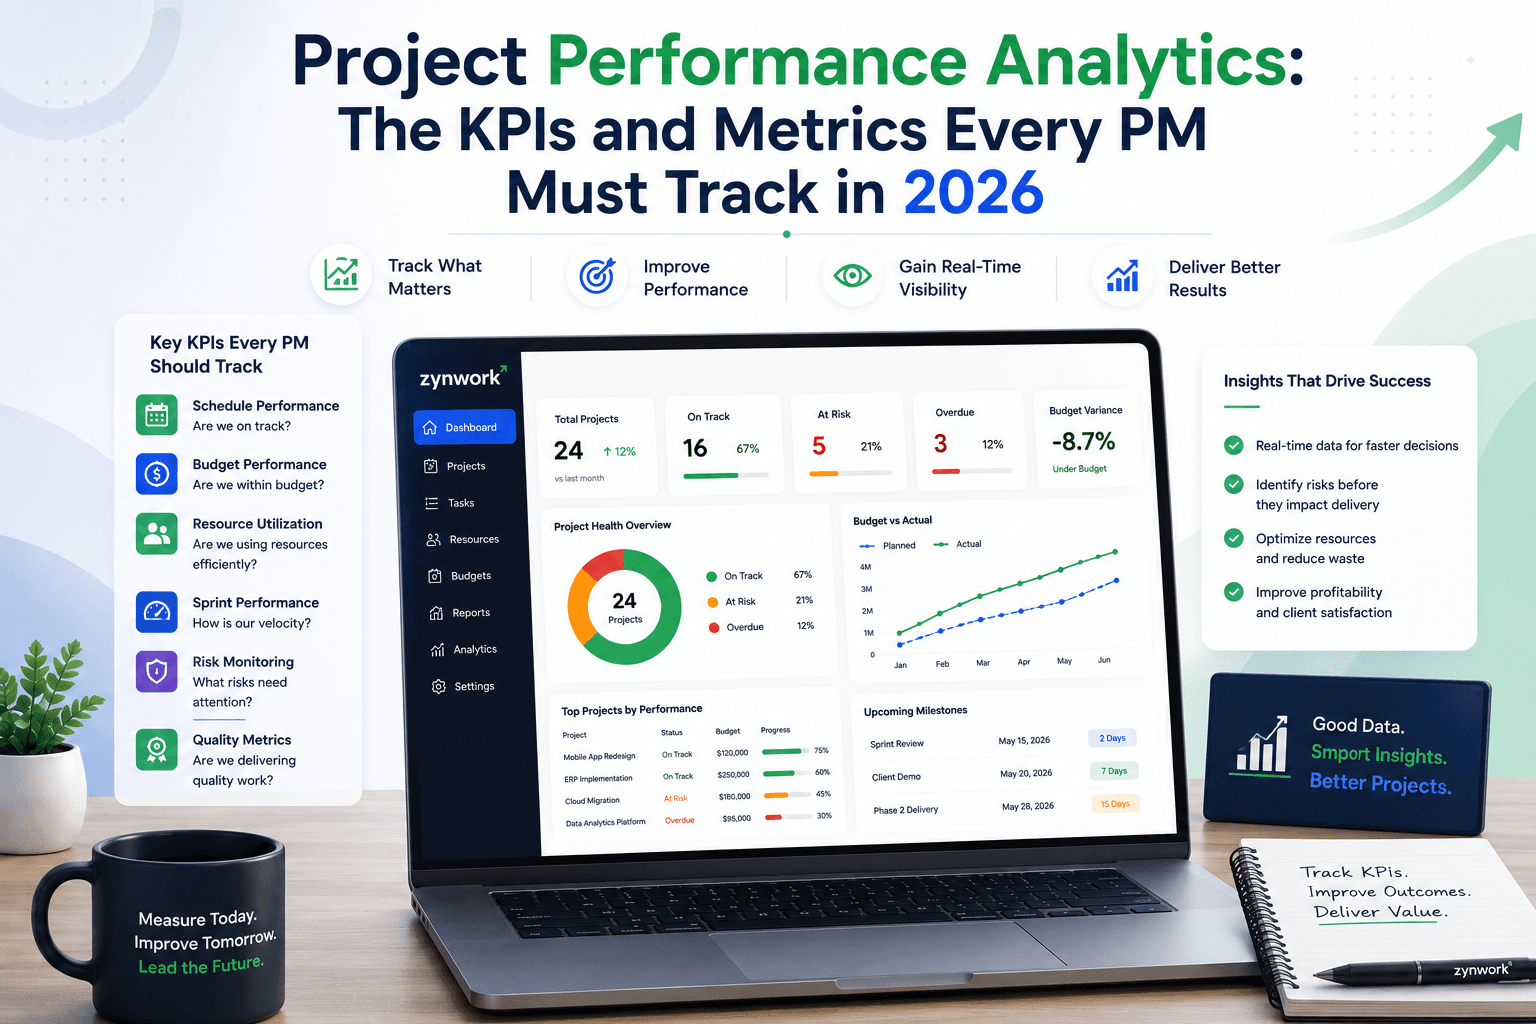
Imagine this.
Your project launches on time. The client is happy, the team celebrates, and everyone moves on to the next assignment.
A week later, leadership asks a few simple questions:
Was the project profitable?
Which team members were overloaded?
Did we stay within budget?
How productive was the team?
Which risks slowed delivery?
Suddenly, nobody has clear answers.
Some reports live in spreadsheets. Others are hidden inside different project tools. Finance has one version of the numbers while delivery managers have another.
This is one of the biggest reasons modern IT organizations are investing in project performance analytics.
Project success today isn't measured by deadlines alone. Teams need visibility into delivery, budgets, productivity, resources, risks, and overall business performance.
At Zynwork, we've seen that organizations making decisions based on real-time analytics consistently deliver projects more efficiently than teams relying on historical reports.
In this guide, we'll explore the most important KPIs every project manager should track in 2026 and how modern analytics platforms help turn project data into better decisions.
Why Project Performance Analytics Matters More Than Ever
Modern IT projects are more complex than ever before.
Teams now manage:
Multiple client projects
Hybrid workforces
Agile sprints
Changing customer requirements
Larger budgets
Distributed resources
Without connected analytics, project managers often spend hours collecting data instead of acting on it.
That's why project performance analytics has become a core capability for modern delivery teams.
Instead of reacting to problems after they happen, analytics helps leaders identify risks while projects are still in progress.
What Is Project Performance Analytics?
Project performance analytics is the process of collecting, measuring, and analyzing project data to evaluate delivery performance and improve decision-making.
Rather than looking only at completed tasks, analytics combines information from multiple areas, including:
Schedule performance
Budget usage
Resource utilization
Team productivity
Risk indicators
Sprint progress
Client deliverables
Financial performance
The goal is simple:
Help project managers make smarter decisions using real-time information instead of assumptions.
Traditional Reporting vs Modern Analytics
Traditional Reporting | Modern Project Analytics |
Static spreadsheets | Live dashboards |
Weekly or monthly reports | Real-time insights |
Manual data collection | Automated reporting |
Separate systems | Connected project intelligence |
Reactive decision-making | Predictive analytics |
Limited visibility | Complete project health monitoring |
Modern organizations increasingly prefer connected analytics because decisions become faster and more accurate.
The Most Important KPIs Every PM Should Track
Tracking dozens of metrics creates unnecessary complexity.
Instead, focus on KPIs that directly influence project success.
1. Schedule Performance
One of the first indicators of project health is schedule adherence.
Questions to monitor include:
Are milestones being completed on time?
Which tasks are delayed?
Are dependencies causing bottlenecks?
Real-time dashboards allow project managers to identify schedule risks before deadlines are missed.
2. Budget Performance
Projects delivered on time but over budget still reduce profitability.
Key financial metrics include:
Budget consumed
Planned vs actual cost
Cost variance
Forecasted spending
Combining financial intelligence with project execution creates much stronger decision-making.
3. Resource Utilization
Resources are often the most expensive part of any IT project.
Track:
Team workload
Capacity utilization
Billable hours
Idle time
Overtime
Balanced resource planning improves productivity while reducing burnout.
4. Sprint Performance
For Agile teams, sprint metrics provide valuable delivery insights.
Important indicators include:
Sprint completion rate
Velocity trends
Carry-forward work
Blocked tasks
These metrics help improve future sprint planning while increasing delivery predictability.
5. Risk Monitoring
Successful project managers identify risks early.
Useful indicators include:
Overdue tasks
Budget deviations
Resource conflicts
Scope changes
Approval delays
Predictive analytics makes risk management far more proactive.
6. Quality Metrics
Fast delivery means little if quality suffers.
Track:
Defect rate
Rework percentage
Client feedback
Testing success rate
Bug resolution time
Quality KPIs help maintain customer satisfaction while reducing long-term costs.
Why Project Deliverables Need Better Visibility
Completing tasks isn't the same as delivering value.
Modern organizations increasingly monitor project management deliverables alongside schedules and budgets.
Typical deliverables include:
Software releases
Documentation
Client approvals
Feature deployments
Training materials
Tracking project management deliverables helps teams understand whether planned outcomes are being completed on time, within scope, and at the expected quality level.
Why Reporting Tools Matter
Analytics is only valuable when information is easy to understand.
Modern project reporting tools provide:
Executive dashboards
Team dashboards
Portfolio reporting
Financial summaries
Resource reports
Delivery insights
Instead of manually preparing reports every week, project managers can access live project information whenever it's needed.
Essential KPIs at a Glance
KPI | Why It Matters | Business Impact |
Schedule Performance | Tracks delivery progress | Prevents delays |
Budget Performance | Controls project costs | Improves profitability |
Resource Utilization | Optimizes workloads | Increases productivity |
Sprint Velocity | Measures Agile delivery | Better planning |
Risk Score | Detects issues early | Reduces project failures |
Quality Metrics | Maintains standards | Improves customer satisfaction |
Common Mistakes When Measuring Project Performance
Many organizations collect data but fail to generate meaningful insights.
Common mistakes include:
Tracking too many KPIs
Using outdated reports
Relying on spreadsheets
Ignoring financial metrics
Measuring activity instead of outcomes
Reviewing reports too late
The best project managers focus on a small number of meaningful metrics that support faster decision-making.
Features to Look for in Analytics Software
When evaluating analytics platforms, look for:
Real-time dashboards
Custom KPI tracking
Budget visibility
Resource analytics
Forecasting
Automated reports
Portfolio management
AI-powered insights
Connected analytics platforms reduce reporting effort while improving project visibility.
Why Connected Analytics Improves Decision-Making
Instead of switching between multiple tools, modern organizations increasingly prefer one platform where they can see:
Project progress
Financial performance
Team workload
Resource allocation
Risks
Deliverables
Portfolio health
This unified approach enables faster, more informed decisions across every stage of project delivery.
Final Thoughts
Project management in 2026 is no longer just about completing tasks.
Successful organizations use project performance analytics to understand what is happening across every project in real time. By tracking meaningful KPIs, monitoring project management deliverables, and using modern project reporting tools, project managers gain the visibility needed to improve delivery, reduce risks, and make better business decisions.
If you're looking for a platform that combines project dashboards, financial intelligence, resource management, and real-time analytics in one place, Zynwork helps modern IT teams deliver projects with greater visibility, confidence, and control.
Ready to make smarter project decisions? Discover how Zynwork helps your team turn project data into actionable insights with powerful analytics and reporting.